
There is no single 'best' Plinko setting, but there is a best way to choose one. In BGaming Original Plinko, three controls shape every session: the Lines selector for rows, the Risk Level toggle (Low, Normal, High), and the bet stake. Each does a different job, and confusing them is how practice budgets evaporate. This guide works through a fixed 100-credit FUN budget, shows the real 16-row maths for each risk level, and explains how to compare settings fairly so the numbers you collect actually mean something. Everything here uses virtual FUN credits with no cash value.
Rows, risk and stake are different decisions
The first mistake players make when hunting for the best Plinko setup is treating the three main controls as one dial. They are not. Lines selects the row count, and the official rules and current interface allow 8 to 16 rows. This guide deliberately fixes 16 rows throughout, because that is the configuration our verified probability data describes. Changing rows changes the number of pockets and the shape of the landing distribution, so mixing row counts mid-comparison muddies everything else.
Risk Level is the second decision, with Low, Normal and High options. At the same row count, risk changes only the payout multipliers printed on the pockets. It does not change where the ball lands. The ball's path probabilities are identical across all three risk levels at 16 rows.
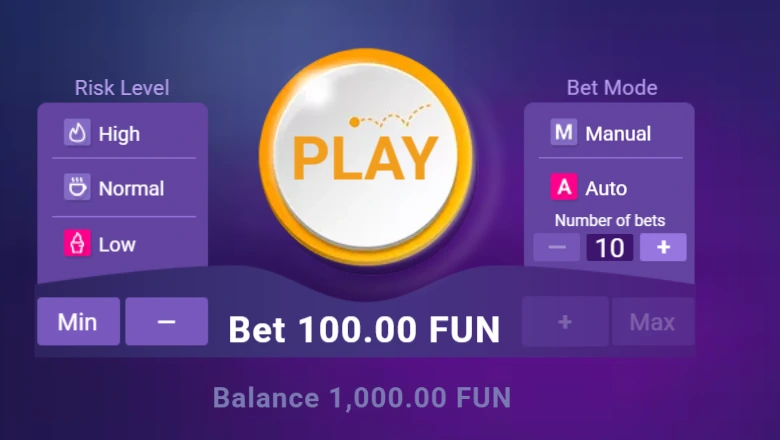
The bet stake is the third decision, controlled with the minus and plus buttons or the Min and Max shortcuts. Stake scales everything linearly. A 2 FUN bet at a 0.5x pocket returns 1 FUN for a net of −1; the same pocket at 4 FUN returns 2 FUN for a net of −2. Stake changes the size of wins and losses, never their likelihood.
Bet Mode, Manual or Auto, is a delivery mechanism rather than a setting that changes odds. Auto exposes a number-of-bets count and a Stop button, which is useful for running a fixed batch of drops hands-free, but we did not observe native stop-loss or take-profit controls, so any loss limit you want has to be one you enforce yourself.
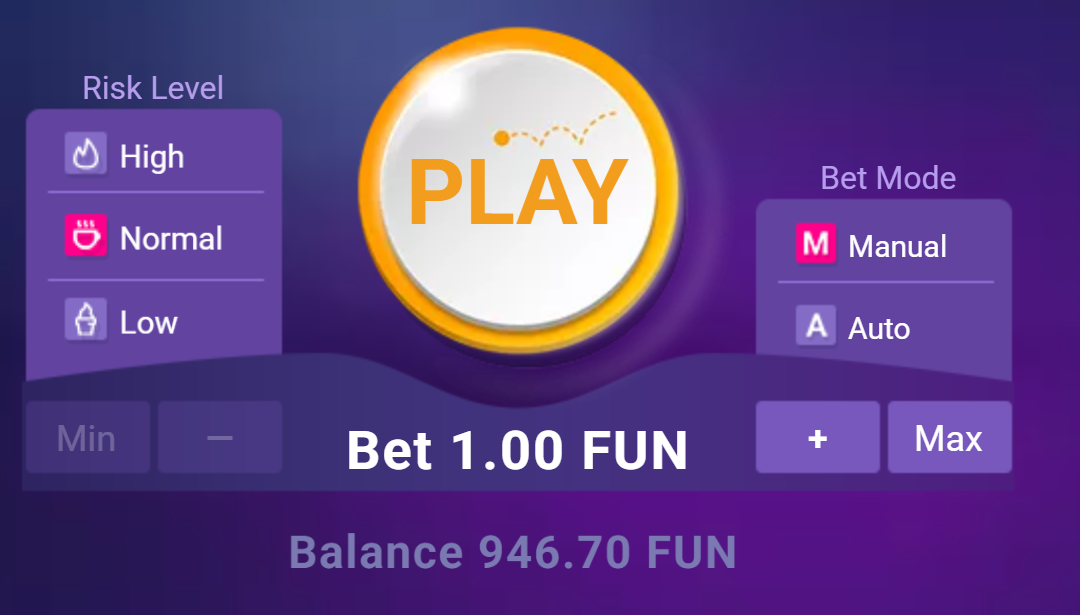
One practical display note before you start measuring anything: multiple moving balls on screen can be separate, already-settled drops, and the animation may lag behind your balance. When comparing settings, trust the balance change and the bet history, not the visual of balls still bouncing. If you are new to the controls entirely, the step-by-step Plinko walkthrough covers the interface before you worry about tuning it.
- Fix Lines at 16 for the whole comparison so the probability vector stays constant.
- Pick one Risk Level per test batch, not per drop.
- Set a flat stake, such as 1 FUN, and do not touch it mid-batch.
- Use Manual mode while learning; switch to Auto with a set number of bets only when you want a repeatable batch size.
- Record balance before and after each batch rather than watching ball animations.
Read the centre before looking at the edges
Every 16-row Plinko board, regardless of risk level, drops balls into 17 pockets indexed 0 to 16, and the landing pattern follows a Binomial(16, 0.5) distribution. In plain terms, each row is effectively a coin-flip left or right, and after 16 flips the ball settles where the flips balance out. The centre pocket, index 8, catches C(16,8)/65536 of drops, which is 19.638% — almost exactly one drop in five.
The edges are the mirror image of that concentration. Landing in either outermost pocket has a probability of 2/65536, or 1 in 32,768, and one specific edge pocket is 1/65536. That is why the giant multipliers live on the edges: the 1000x pocket on High risk is not a generous gift, it is a payout priced against a one-in-65,536 chance per side, or one in 32,768 for either side combined.
This shape is bell-like but it is a binomial distribution, not an exact continuous normal curve, and the normal approximation is poor in the rare tails. If you try to estimate edge-hit frequency with a bell-curve shortcut, you will overstate how often the big pockets arrive. For practice purposes, the honest summary is: expect the middle, plan around the middle, and treat edge hits as rare bonuses rather than a strategy.
Because Low, Normal and High at 16 rows all share this same landing vector, the risk toggle is purely a payout decision. Low risk pays you more for the common centre outcomes; High risk starves the centre and loads the edges. Our Plinko odds breakdown lists the full pocket-by-pocket probabilities if you want to see every index, and the Plinko simulator lets you watch the binomial shape emerge over large drop counts.
What the centre pocket pays on each risk level
The centre pocket tells you the personality of each risk level in one number. On Low risk, index 8 pays 0.5x — a small loss, but the pockets immediately beside it pay 1x and 1.1x, so the most common region hovers around break-even. On Normal risk, the centre pays 0.3x, a steeper haircut on the most likely outcome. On High risk, the centre and its neighbours all pay 0.2x, meaning the single most probable result of any drop is losing 80% of your stake. That is the trade you make for access to the 1000x edges.
Can you choose that stake in the game?
The amount buttons matter when you take a rule out of a spreadsheet. In our FUN interface, successive plus presses select 1, 2, 3, 5, 10, 15, 20, 30, 50, 75 and 100. A request for 4 FUN therefore cannot be followed literally with these buttons. The collected study used 1 FUN throughout, so its observed returns are unaffected.
Our original charts calculate ideal stake amounts to cents. The simulator now also has a demo-button option: it checks the minimum and cap first, then lowers an allowed request to the nearest available amount. For instance, a request for 8 becomes 5 FUN. That is a changed progression, so compare its new curve rather than treating it as an exact Martingale. Percentage stakes stop below the 1 FUN minimum. The selected full-history centre rules use 1 and 50 FUN, both available amounts.
| Pocket position | Probability per drop | Low risk pays | Normal risk pays | High risk pays |
|---|---|---|---|---|
| Centre (index 8) | 19.638% | 0.5x | 0.3x | 0.2x |
| Adjacent (index 7 or 9) | 17.456% each | 1x / 1x | 0.5x / 0.5x | 0.2x / 0.2x |
| Either outermost edge | 0.00305% combined | 16x | 110x | 1000x |

A worked 100-credit practice budget
Abstract percentages only become useful when attached to a real budget, so here is a concrete worked example. Take a practice allocation of 100 FUN — remembering FUN credits are virtual, denominated at 100 minor units per credit, and are not AUD and carry no cash value. The question is how far that budget stretches under each risk level at a flat 1 FUN stake.
Settlement is always stake multiplied by the pocket multiplier, with the stake subtracted to get the net. A 2 FUN bet landing on 0.5x returns 1 FUN, a net of −1. A 2 FUN bet landing on 9x returns 18 FUN, a net of +16. Every drop resolves this way instantly, even if the ball animation is still playing out.
On Low risk at 1 FUN per drop, the theoretical return is about 98.999% of staked volume, so 100 drops through your 100 FUN budget has an expected cost of roughly 1 FUN. More importantly for the feel of the session, about 45.45% of drops return a profit, 34.91% break even, and only 19.64% — the exact centre-pocket share — lose. Your balance line moves in small, frequent steps.
On High risk, the same 100 drops have a similar theoretical cost, about 1.02 FUN per 100 staked, but the experience is unrecognisable. Roughly 78.99% of drops lose, there is no break-even pocket at all, and the standard deviation per drop is 6.57x stake versus 0.33x on Low. In a 100-drop batch you would expect long losing runs punctuated by the occasional 9x or 26x, and you would not expect the 1000x at all — at 1/65536 per side (1/32768 for either edge combined), a hundred drops gives you about a 0.3% chance of seeing either edge.
The practical lesson: a fixed budget does not produce a fixed session length in feel. Low risk turns 100 FUN into a long, calm observation session. High risk can take a visible bite out of the balance in twenty drops, and a single 130x or 1000x hit can more than double it, but the doubling outcomes are rare rather than normal. Choose the risk level that matches what you are practising for, not the one with the prettiest maximum.
- Set aside exactly 100 FUN and note the starting balance.
- Run 100 Manual drops at 1 FUN on Low risk; note ending balance and how many drops profited.
- Reset to 100 FUN and repeat on Normal, then High.
- Compare the three ending balances against the theoretical expectations, not against each other as a single lucky or unlucky batch.
- Repeat the exercise before drawing any conclusion, because one batch of 100 is a tiny sample.
Compare low, normal and high risk
With the same 16-row landing vector underneath, the three risk levels are best compared on four numbers: theoretical RTP, profit probability, loss probability, and standard deviation. The full multiplier tables are reproduced below so you can see exactly where each level puts its money.
Low risk is the steady option. Its theoretical RTP is 98.999%, the highest of the three by a hair. It profits on 45.45% of drops, breaks even on 34.91%, and loses only on the 19.64% of drops that hit the exact centre. Its standard deviation is 0.33x stake, the lowest by far, and its top prize is 16x. Low risk is the setting where your recorded results will converge on the theory fastest, which makes it the right choice for learning and for testing staking rules.
Normal risk reshuffles the same probabilities into a spikier payout table: 110x at the edges, but a 0.3x centre. Theoretical RTP dips slightly to 98.988%. Profit probability falls to 21.01%, break-even covers 24.44%, and 54.55% of drops lose. Standard deviation rises to 1.47x stake. Normal is the middle ground for players who find Low boring but want losing runs measured in tens of drops, not hundreds.
High risk is the edge-hunter. The 1000x maximum dominates the table, but the centre five pockets all pay 0.2x. Theoretical RTP is 98.976% — again only fractionally lower — yet 78.99% of drops lose, nothing breaks even, and standard deviation is 6.57x stake. High risk is a legitimate choice if your goal is specifically to experience rare-event chasing, but go in knowing that 'due for a big one' is not a thing: drops are independent, and past outcomes do not establish any predictability about the next pocket.
Notice the RTPs are nearly identical. The risk toggle changes volatility, not generosity. Over very long play all three cost about the same per credit staked. What differs is the ride, the sample size you need before results mean anything, and the psychological load of the losing runs.
| Measure (16 rows) | Low | Normal | High |
|---|---|---|---|
| Theoretical RTP | 98.9987% | 98.9883% | 98.9764% |
| Profit probability | 45.45% | 21.01% | 21.01% |
| Break-even probability | 34.91% | 24.44% | 0% |
| Loss probability | 19.64% | 54.55% | 78.99% |
| Std deviation (x stake) | 0.33 | 1.47 | 6.57 |
| Max multiplier | 16x | 110x | 1000x |
| Edge probability (either side) | 1 in 32,768 | 1 in 32,768 | 1 in 32,768 |
Settings that make a comparison fair
Most 'I tested the best Plinko settings' claims fall apart because the comparison was rigged by accident. A fair test needs controls, and the first control is a fixed stake. Our replay protocol uses a flat stake of 1 FUN as the baseline for exactly this reason: when the stake never moves, any difference in outcomes comes from the risk level or the rows, not from bet sizing noise.
The second control is batch size. A 100-drop batch on Low gives a rough feel for the common pockets, but the same batch on High says little about its 1,000× edges: their expected combined count is about 0.003. Our completed study contains 3,000 drops, 1,000 per risk, with ten setup drops excluded. Even that is a modest sample for rare pockets. The recorded results and fitted settings show what happened, including positive full-history replays and the separate 600/400 split checks. Use those settings as examples to reproduce, not a claim that the next batch will pay similarly.
The third control is honesty about fitting. If you search a full 1000-drop sample for the rule that would have performed best, you have done retrospective fitting — the rule was chosen because it won on that exact data. A cleaner approach is to select a rule using the first 600 rows, freeze it, then evaluate it on the last 400 rows it has never seen. An all-1000-row best fit is not held-out evidence.
The fourth control is understanding what a seed hash is and is not. A seed hash shown before or after play is a commitment artifact, not the unrevealed seed and not a forward prediction. Changing seeds, tapping the board five to eight times, or raising stakes after 25 low 0.2x returns in 30 drops are all real questions players ask on international forums, but none of them are proven winning methods — independence of drops means no pattern in past outcomes constrains the next one.
Finally, keep your environment fair too: same row count, same device, Manual or Auto used consistently, and results read from the balance rather than from lagging ball animations.
Staking rules, explained mechanically
If you move beyond flat staking in practice play, know what each classic rule actually does. A percentage rule bets a fixed share of bank — 0.5% rounded down to whole 0.01 FUN — so stakes shrink after losses. Martingale doubles after a net loss and resets to base after a net win, which recovers losses quickly until a losing run makes the next bet infeasible; a capped martingale (1-2-4-8-16 then reset) bounds that blow-up. D’Alembert adds one base unit after a loss and subtracts one after a win, a gentler ladder. Fibonacci advances one step along 1,1,2,3… after a net loss and steps back two after a win. Paroli doubles after a net win, up to three wins, then resets — it presses hot streaks rather than chasing cold ones. The 1–3–2–6 sequence progresses through successive net wins and resets after any loss. Stop-limit rules pause when cycle net reaches −20 or +20; restart variants resume immediately with the remaining bank, and combined losses are never erased. Whatever the rule, a well-built test stops before an infeasible bet rather than silently clipping the stake to what is left. None of these rules changes the RTP of a single drop; they only reshape the path your balance takes.
Apply a setting without copying another provider’s table
Everything on this page describes BGaming Original Plinko specifically — not Plinko 2, not the Stake or Hacksaw versions, and not arcade or TV boards. Multiplier tables differ between providers, sometimes dramatically, so a 'best settings' screenshot from another game's paytable cannot be transferred here. If you read that High risk pays 1000x at the edge, that is this game's 16-row High table; another provider's board may pay differently at a different probability.
The correct habit is to read the paytable in front of you and reconstruct the trade-off from first principles: find the centre pocket payout, find the edge payout, and remember the probabilities are binomial for the row count shown. A centre of 0.2x tells you the game starves common outcomes; a centre near 1x tells you it cushions them. You can do that arithmetic on any board in about ten seconds, and it beats memorising anyone's table.
The same caution applies to where you play. This guide uses a free virtual-credit demo captured for an Australian editorial project; it is not an Australian operator or location test. In Australia, the ACMA lists online casinos among the services that are illegal for providers to offer to people in Australia, and prohibited services cannot be advertised here. Free virtual-only play, ad-reward apps and funded casino products are genuinely different categories, and the ACCC expects mobile games and their advertising not to mislead about features, price or subscriptions. Our Plinko apps guide goes deeper on those distinctions; the short version for this page is that practice settings should be tuned in free play first, which costs nothing and teaches the most.
To put it all together: fix 16 rows, pick Low risk while you learn, stake a flat 1 FUN per drop from a defined budget, and only change one variable at a time when you test. When you want to see how a setting or staking rule has actually performed across large recorded samples, evaluate it in the results tool as historical evidence — and if you want to experiment hands-on, the free Plinko demo runs the same game this page describes.
- Open the paytable on the board you are actually playing and note the centre and edge multipliers.
- Set Lines to 16 and Risk to Low; stake 1 FUN flat.
- Play one fixed batch, record the result, then change exactly one setting for the next batch.
- Treat any historical winning configuration as something to evaluate in the results tool, never as a promise about future drops.
- Keep practice in free virtual-credit play; FUN credits are not AUD and have no cash value.
Questions about Plinko
What are the best Plinko settings for a small practice budget?
Fix 16 rows, choose Low risk, and stake a flat 1 FUN. Low risk returns about 98.999% theoretically, profits on roughly 45% of drops, and has the lowest variance, so a small FUN budget lasts longer and your recorded results converge on the true odds fastest.
Does changing risk level change where the ball lands?
No. At 16 rows, Low, Normal and High share the identical Binomial(16, 0.5) landing vector — the centre pocket catches 19.638% of drops on every risk level. Risk only changes the multipliers printed on the pockets, not the physics of the drop.
How often does the 1000x pocket hit on High risk?
Either outermost edge lands with probability 2/65536, about 1 in 32,768 drops, and one specific edge is 1/65536. In 100 drops you have roughly a 0.3% chance of seeing either edge, so short sessions almost never include a 1000x hit.
Is Normal risk a good compromise between Low and High?
It depends on your goal. Normal keeps the 110x edge prize and a 21% profit probability, but 54.55% of drops lose and the standard deviation is 1.47x stake. It suits players who want real edge potential without High risk's 79% loss rate and brutal centre payouts.
Do staking systems like martingale improve Plinko results?
No staking rule changes the per-drop RTP, which stays near 98.99% regardless. Martingale and its variants only reshape your balance path, and doubling after losses eventually hits an infeasible bet. Treat staking rules as practice experiments, not edges.
Can I use another provider's Plinko paytable to pick settings here?
No. This page covers BGaming Original Plinko only; Plinko 2, Stake and Hacksaw versions use different tables and sometimes different row ranges. Always read the paytable on the board in front of you and reason from its centre and edge multipliers.