
We recorded 3,000 completed drops in the BGaming Original Plinko demo: 1,000 each on Low, Normal and High, all at 16 rows and 1 FUN per drop. Then we replayed ten staking rules and searched 600 centre-count configurations per risk. This page separates actual demo returns, hypothetical staking replays and a retrospective 600/400 split check. The records are real; changing a stake in a replay is a calculation, not another live bet.
| Risk | Previous paid drops | Centre hits ≤ | Raised total stake | Paid cooldown | Full-history net |
|---|---|---|---|---|---|
| Low | 8 | 2 | 50 FUN | 3 | +156.7 FUN |
| Normal | 16 | 4 | 50 FUN | 8 | +2,175.4 FUN |
| High | 8 | 4 | 50 FUN | 5 | +4,367.4 FUN |
These settings were chosen using all 1,000 pockets at each risk. They are historical fits, not settings validated for future profit. The fresh-bank split check below selects a different rule using only its first 600 rows.
Find the replay that fits your question
Different readers arrive here with different questions, so the work is split into matching pieces. If you want to know what the game itself returns at each risk level, the three measured 1,000-drop samples answer that directly: stake, return, net, drawdown, streaks and pocket counts, all recorded drop by drop on 30 October 2026. If your question is whether a staking system changes the outcome, the ten baseline replays run each rule over the exact same pocket sequence the flat-bet sample produced, so any difference comes from the staking rule alone, not from a luckier run of balls.
If you have seen claims about pattern-based play — raising stakes after a run of centre pockets, for instance — the retrospective search and the frozen split check speak to that. The search shows the best-looking configuration a computer can find after seeing all 1,000 rows. The split check shows what happens when a rule chosen on the first 600 rows is locked and then scored on rows 601–1000 with a fresh 1,000 FUN bank and empty history. Those are very different numbers, and the gap between them is the most useful lesson on this page.
Everything here uses the official demo of BGaming Original Plinko — not Plinko 2, Stake's version, Hacksaw's, or any arcade or TV board. Rows are fixed at 16, stakes start at 1 FUN, and FUN credits are virtual only: 100 minor units per credit, no AUD, no cash value. For controls and mechanics see how to play, and for the underlying maths see the odds page.
Read the three measured samples
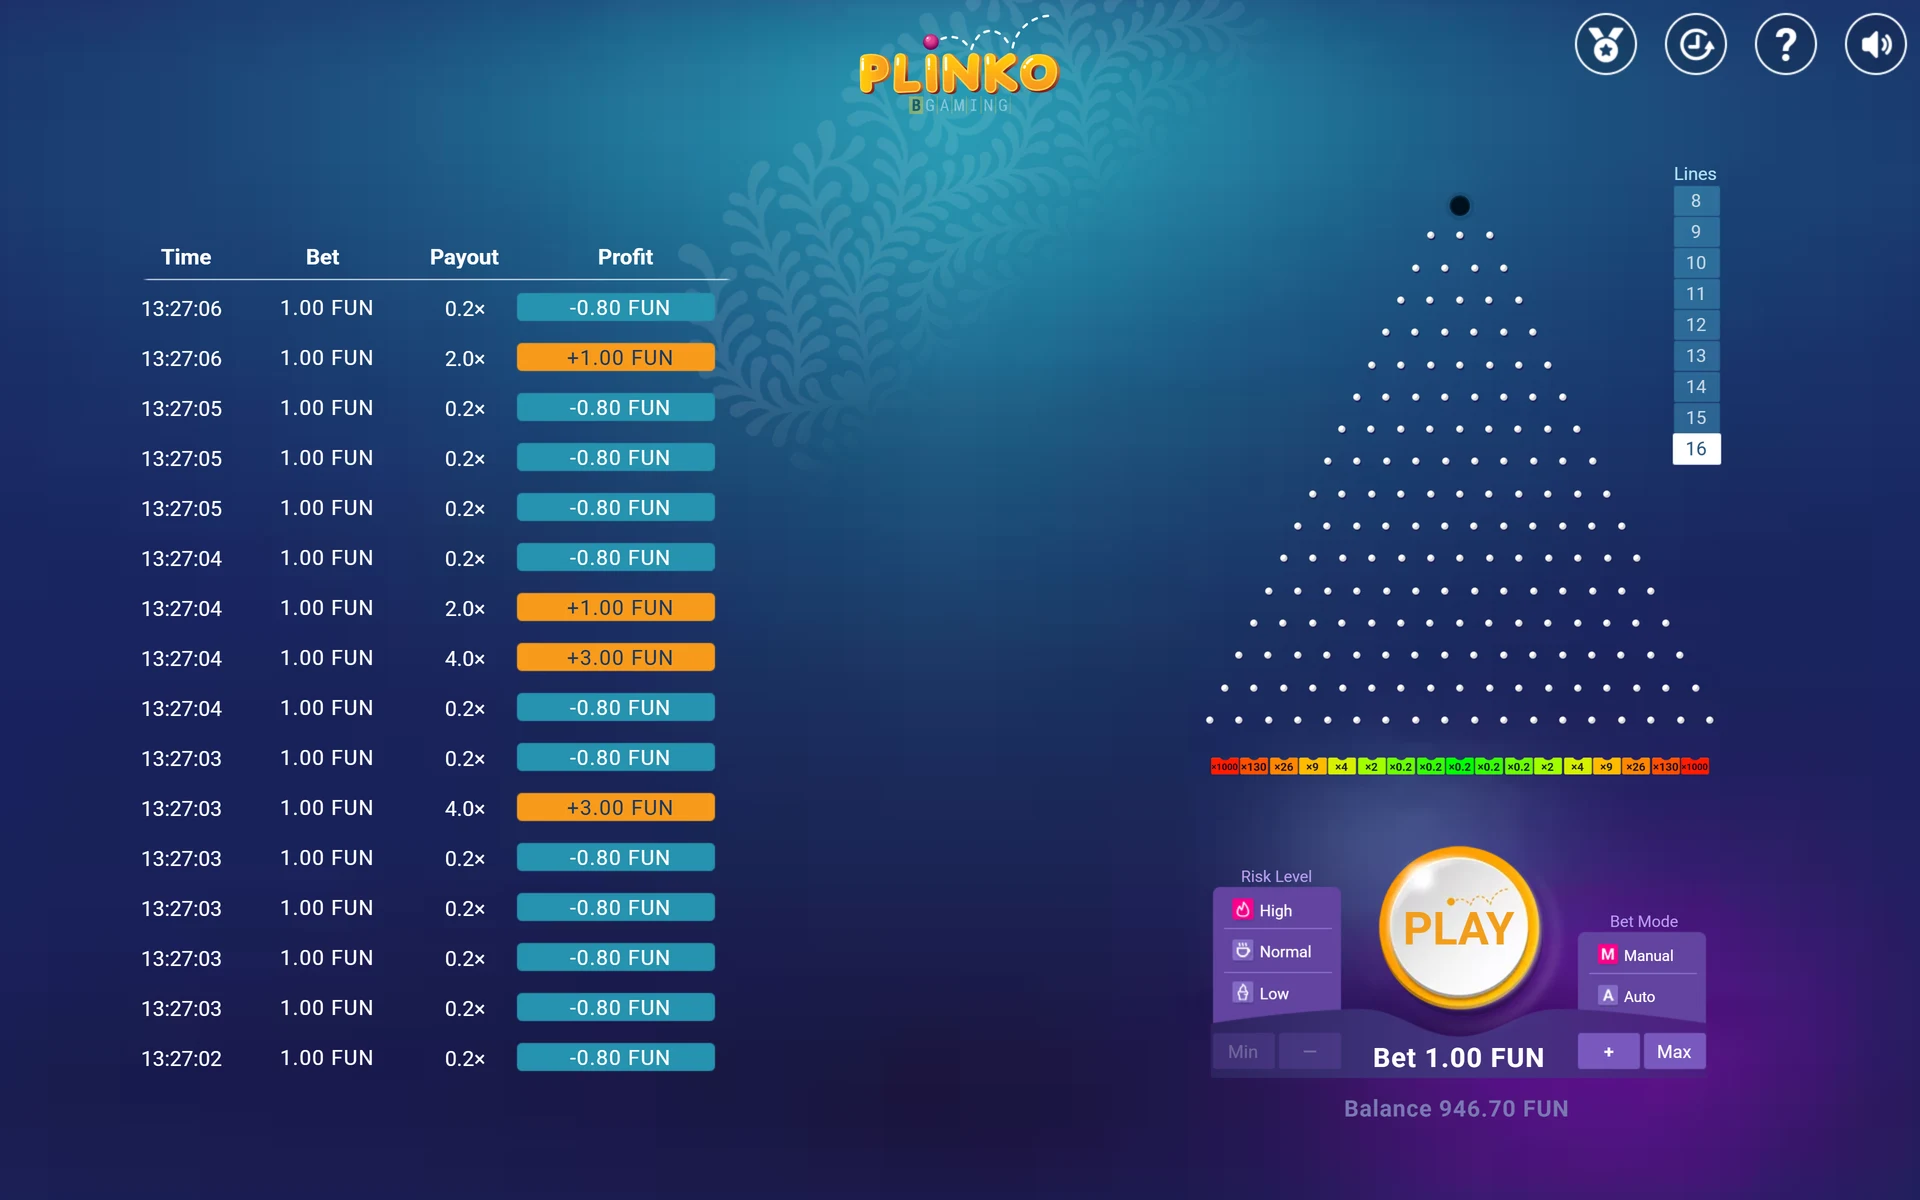
Low risk, 1,000 drops at 1 FUN each: 1,000 FUN staked, 970.5 FUN returned, net −29.5, an observed RTP of 97.05% against a theoretical 98.999%. The 1.95-point gap is about 1.86 theoretical standard errors; one standard error is about 1.05 percentage points here. A single sample is not a test that proves or disproves fair play. 433 drops were profitable, 353 broke even and 214 lost; the 95% Wilson interval for the profitable-drop rate runs from 40.3% to 46.4%, comfortably containing the theoretical 45.45%. Maximum drawdown was 31.3 FUN, the longest losing streak was 4, and the largest multiplier seen was 2x — the 9x and 16x edge pockets never landed, which is expected: the chance of at least one 16x in 1,000 drops is only about 3.0%.
Normal risk returned 1,019.4 FUN on the same 1,000 staked: net +19.4, observed RTP 101.94% versus a theoretical 98.988%. Here only 232 drops were profitable, 256 broke even and 512 lost — the theoretical loss probability is 54.55%, so losing most drops while finishing ahead is exactly how this table is built. The largest multiplier observed was 41x, the longest losing streak was 8, and drawdown reached 35.1 FUN. The theoretical standard error at this risk level is about 4.64 percentage points, so a result three points above theory is unremarkable.
High risk returned 957.4 FUN: net −42.6, observed RTP 95.74% against a theoretical 98.976%, with a standard error of roughly 20.76 points — this table's 6.57x standard deviation makes 1,000 drops a small sample. 203 drops won, none broke even (the high table has no 1x pocket), and 797 lost, with a longest losing streak of 24 and maximum drawdown of 157.6 FUN. The biggest hit was 26x; the 130x and 1,000x pockets never appeared. Pocket counts across all three samples tracked the Binomial(16, 0.5) shape — centre pocket near its 19.64% expectation, edges empty — consistent with the published vector.
The 100-drop windows show how lumpy short sessions are. Low risk's windows ranged from +0.3 to −6.9 FUN. High risk swung from +35.6 (drops 301–400) to −39 (701–800). Anyone judging the game, or a strategy, on a few dozen drops is reading noise.
Can you choose that stake in the game?
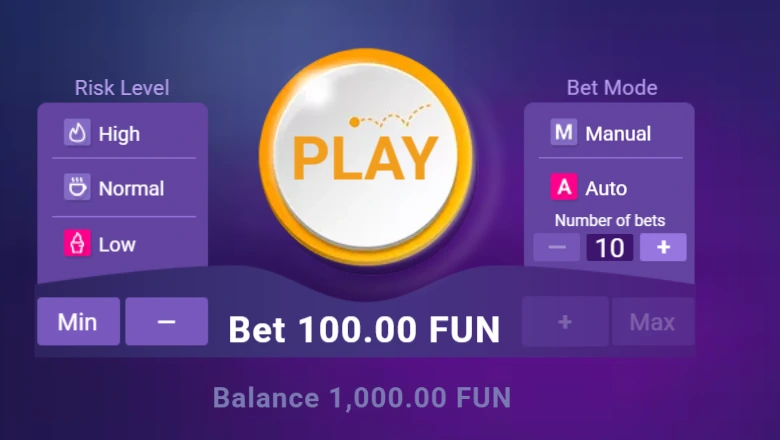
The amount buttons matter when you take a rule out of a spreadsheet. In our FUN interface, successive plus presses select 1, 2, 3, 5, 10, 15, 20, 30, 50, 75 and 100. A request for 4 FUN therefore cannot be followed literally with these buttons. The collected study used 1 FUN throughout, so its observed returns are unaffected.
Our original charts calculate ideal stake amounts to cents. The simulator now also has a demo-button option: it checks the minimum and cap first, then lowers an allowed request to the nearest available amount. For instance, a request for 8 becomes 5 FUN. That is a changed progression, so compare its new curve rather than treating it as an exact Martingale. Percentage stakes stop below the 1 FUN minimum. The selected full-history centre rules use 1 and 50 FUN, both available amounts.
| Risk | Drops | Stake · FUN | Returned · FUN | Observed return | Net · FUN |
|---|---|---|---|---|---|
| Low | 1000 | 1000 | 970.5 | 97.05% | −29.5 |
| Normal | 1000 | 1000 | 1019.4 | 101.94% | +19.4 |
| High | 1000 | 1000 | 957.4 | 95.74% | −42.6 |
Compare the ten baseline rules
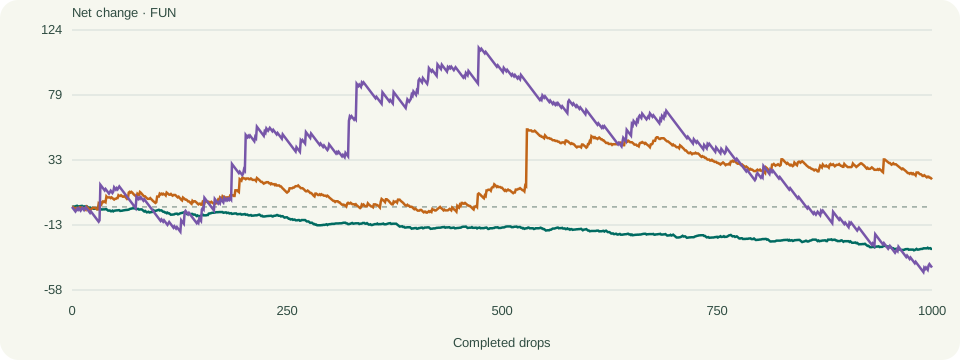
Each rule was replayed over the identical pocket sequence with a 1,000 FUN bank, 1 FUN base, a 100 FUN stake cap, and a hard STOP before any infeasible bet — stakes are never silently clipped. On Low risk, every rule finished negative. Flat betting lost 29.5 FUN; the percentage rule (0.5% of bank, rounded down to 0.01 FUN) lost 137.31 FUN on 4,640.91 FUN of turnover; D’Alembert lost 58.4; Paroli lost 64.7; 1–3–2–6 lost 53.9. Martingale and its capped 1-2-4-8-16 variant produced identical results here (−39.5) because no loss run reached the cap. The stop-limits rule paused at drop 692 on a −20.1 cycle net; the restart variant resumed immediately and, because the underlying bets were flat, finished exactly where flat betting did.
Normal risk flattered several rules because the sample itself ran hot. Flat betting made +19.4. Capped martingale finished +181.4 on 3,772 FUN staked — a 104.81% replay RTP — while full martingale hit the 100 FUN stake cap at drop 87 and stopped +65.8. The percentage rule made +71.58 but drew down 210.26 FUN along the way. D’Alembert was the cautionary case: it escalated to the stake cap by drop 368 with a 1,421.8 FUN drawdown and a 176.6 FUN loss despite the favourable sequence. Fibonacci stopped at the cap on drop 88, down 78.3.
High risk punished escalation hardest. Flat betting lost 42.6 FUN, but the percentage rule lost 248.28, capped martingale 270.6, 1–3–2–6 140.6 and Paroli 133.6. Martingale stopped at the cap on drop 29 (−83), Fibonacci on drop 30 (−179.6, a 34.45% replay RTP), and D’Alembert exhausted the bank at drop 118, down 943.2 FUN. The stop-limits rule paused early on each risk level — on High it stopped at drop 186 with +30.2 — which shows what a ±20 FUN cycle pause does mechanically: it truncates sessions, it does not change per-drop expectation.
The pattern across all 30 replays is consistent: staking rules redistribute when wins and losses arrive and how large the swings are, but replay returns vary with the chosen stakes and stopping point. The aggressive progressions often add drawdown or stop early. For definitions of each rule see the strategies guide.
Inspect a retrospectively selected setting
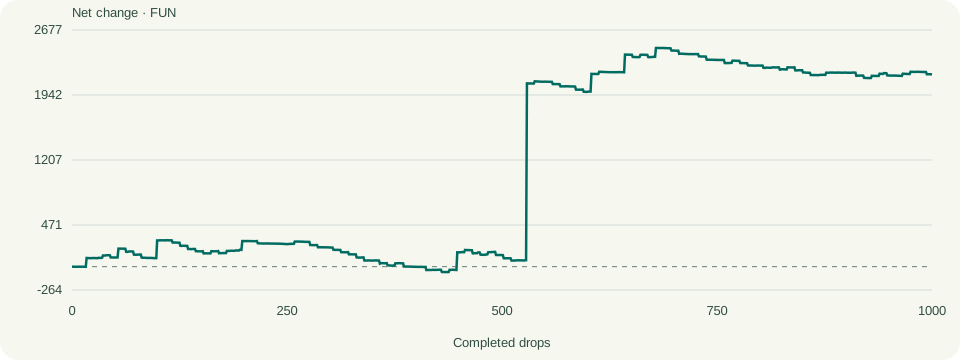
The search tested 600 configurations of a centre-count rule per risk level: the rule bets the base stake, but when the previous rolling window contains at most the specified number of centre-pocket landings, the next total stake is raised to the specified amount, with a paid cooldown that still spends base stakes and updates history. Of the 600 tried, 592 completed on Low, 598 on Normal and 558 on High; the rest stopped early on caps or balance. The best full-sample configurations were striking. Low: window 8, threshold 2 centres, 50 FUN total stake, cooldown 3 — net +156.7 FUN, 101.44% RTP on 10,849 FUN staked. Normal: window 16, threshold 4, 50 FUN total stake, cooldown 8 — net +2,175.4, 137.81% RTP. High: window 8, threshold 4, 50 FUN total stake, cooldown 5 — net +4,367.4, 148.33% RTP on 9,036 FUN staked.
Those numbers are real replays, but they were selected because they topped the same 1,000 rows they were scored on. That is retrospective fitting: with 600 candidates and a noisy target, the winner is selected for how well its larger stakes happened to align with that particular sequence. On High risk, for example, a handful of 26x hits at 50 FUN instead of 1 FUN accounts for most of the +4,367.4. An all-rows best fit is not evidence the rule detected anything about future drops — the model treats drops as independent, and a centre-heavy window does not make the next pocket more predictable.
We report these positive historical examples deliberately and with their amounts, because hiding them would be as misleading as promoting them. They show what the best-case replay looked like; the next section shows what the same kind of rule did when it was not allowed to see the rows it was judged on.
Centre-count rule
Count centre pockets in the previous paid drops, then conditionally raise the next stake.
The graph uses mathematical stake amounts. Exact doubles and percentage stakes may be absent from the game’s buttons; choose demo amounts in the simulator to compare the adjusted version.
Exactly what to do on each drop
- Use 1 FUN on ordinary drops. Count the centre pocket (index 8, ninth from the left) in the previous 16 completed paid drops.
- If that count is at most 4, put a total stake of 50 FUN on the next drop. This is the entire stake, not 50 times a separate stake.
- After a raised bet, place 8 paid drops at 1 FUN before checking again. Every completed drop stays in the rolling history.
- Stop before the required stake exceeds 100 FUN or the remaining bank. These parameters were selected after examining all 1,000 results.
Check a rule on the held-out tail
The split check selects a rule using only rows 1–600, freezes those parameters, then evaluates them on rows 601–1000 with a fresh 1,000 FUN comparison bank and empty history at the split — no refitting. This is still a retrospective split of one recorded sequence, not a prospective or preregistered fresh trial, and the frozen rule can differ from the all-rows best fit. Even so, it is a much sterner test than full-sample selection.
On Low risk the frozen centre rule (window 8, threshold 2, 50 FUN total stake, cooldown 3) made +115.7 FUN on the training rows and +16.5 on the 400 validation rows — a 100.40% validation RTP on 4,173 FUN staked, with a 100.8 FUN drawdown. It stayed positive but shrank to a fraction of its training performance. On High risk the frozen rule (window 8, threshold 4, 50 FUN total stake, cooldown 5) made an extraordinary +4,584.4 in training (184.86% RTP) and +224 on the tail (106.16% on 3,634 FUN staked, 776.8 FUN drawdown) — again positive, again a shadow of the fitted figure, and riding one favourable 400-row slice.
Normal risk is the decisive counterexample. The frozen rule (window 16, threshold 4, 50 FUN total stake, cooldown 0) earned +2,621.6 on its training rows, then lost 974.8 FUN on the validation rows and stopped at drop 342 of 400 with 25.2 FUN left — insufficient balance, a 91.50% validation RTP and a 1,151.1 FUN drawdown. The same family of rule, the same selection method, and the held-out tail used up 974.8 FUN of the 1,000 FUN starting bank. Across the three splits, the frozen rule's edge did not survive contact with unseen rows in any consistent way, and we do not claim a profitable future advantage from any of them. You can rerun variations yourself in the simulator or practise free in the demo.
| Risk | First 600 · fitted net | Last 400 · frozen-rule net | Last 400 bets | Check scope |
|---|---|---|---|---|
| Low | +115.7 | +16.5 | 400 | Retrospective split; not a prospective trial |
| Normal | +2,621.6 | −974.8 | 342 | Retrospective split; not a prospective trial |
| High | +4,584.4 | +224 | 400 | Retrospective split; not a prospective trial |
Understand what the sample cannot establish
Three thousand recorded drops let us reconcile stakes, multipliers and balances, and compare the observed counts with the published probability vector. That does not prove the game is fair, detect a one-in-ten-thousand bias, or say anything about other versions, operators or row counts. On High at 16 rows, either 1,000× edge has a combined 1-in-32,768 chance per drop. The model gives about a 3% chance of at least one hit in that risk’s 1,000 drops. No such hit occurred; its absence is unsurprising. A seed hash commits to an outcome sequence; it is not the unrevealed seed and not a forward prediction, and no result here supports predictor tools — see why predictors cannot work.
The replays share one recorded sequence per risk level, so a rule's win on Normal and loss on High partly reflects those sequences, not a universal ranking. The split checks are single retrospective splits, not fresh trials. And none of it involves money: FUN credits have no cash value. For Australian context, ACMA lists online casinos among services illegal for providers to offer to people in Australia and prohibits their advertising here; nothing on this page is an endorsement of any real-money operator, and no Australian real-money offer is verified by this project. Free virtual play, ad-reward apps and funded casino products are different things — the apps page explains the distinctions. For setting choices within the free game, see best settings.
Questions about Plinko
Did any strategy beat flat betting in the 3,000-drop test?
No rule showed a reliable edge. Some replays finished ahead when the underlying sequence was favourable — capped martingale made +181.4 FUN on the hot Normal sample — but the same rules lost heavily on High risk, and escalation rules repeatedly hit the stake cap or exhausted the bank.
What was the measured RTP at each risk level?
Low: 97.05% (theory 98.999%). Normal: 101.94% (theory 98.988%). High: 95.74% (theory 98.976%). Low is about 1.86 theoretical standard errors below its expected return; Normal and High are within one. A single sample at each risk is not enough to certify fairness or rank future returns.
The centre-boost rule made +4,367.4 FUN on High risk — is that a winning system?
No. That configuration was the best of 600 candidates selected using the same 1,000 rows it was scored on — retrospective fitting. When a rule was frozen on the first 600 rows and checked on the last 400, results shrank or collapsed; the Normal-risk frozen rule lost 974.8 FUN and ran out of balance.
Why did martingale stop before 1,000 drops on Normal and High?
The replay enforces a 100 FUN stake cap and stops before any infeasible bet rather than clipping stakes. On High risk, a 24-long losing environment pushed the doubling progression past the cap by drop 29; on Normal it stopped at drop 87.
Is the 600/400 split check a prospective test?
No. It is a retrospective split of one recorded sequence: the rule is frozen on rows 1–600 and scored on rows 601–1000 with a fresh 1,000 FUN bank and empty history. It is stricter than full-sample fitting but is not a preregistered fresh trial.
Does this test cover real-money play in Australia?
No. All drops used FUN virtual credits with no cash value on the official international demo. ACMA lists online casinos as illegal for providers to offer to people in Australia, and this project verifies no real-money operator.
Inspect the recorded drops
Download the 3,000 completed drops as CSV. Every published row is a settled official-demo drop; no generated simulator rows are included. Ten setup drops are excluded.
Data reuse
All rights reserved in this editorial compilation. You may inspect it for your own non-commercial analysis. Contact the publisher before redistribution. Provider artwork and software are not licensed by this page.