
Search for the best Plinko strategy and you will find confident claims that a certain staking pattern beats the board. This guide tests that idea properly. We work through ten staking rules on BGaming Original Plinko with 16 rows, explain each one mechanically so a beginner can follow it, and show what the maths says each can and cannot do. Everything here uses FUN virtual credits with no cash value, so you can experiment freely in the demo. Staking systems shape your bankroll graph, not where the ball lands; the sections below give worked examples and the exact replay rules our bankroll charts use.
A short answer to the best-strategy question
There is no staking strategy that wins Plinko every time, and the reason is arithmetic rather than bad luck. Every drop on a 16-row board follows the same binomial landing vector: the centre pocket holds C(16,8)/65536, or 19.638% of outcomes, while a single extreme edge pocket holds just 1/65536, with both edges together holding 2/65536 (1 in 32,768). Changing your bet size between drops does not move a single one of those probabilities. Low, Normal and High risk change the payout table, not where the ball lands.
What the payout tables do show is a small, consistent house margin. The mean return multiplier is 0.9899871826171875 on Low (a theoretical RTP of 98.999%), 0.9898834228515625 on Normal and 0.989764404296875 on High. Over a long session you expect to give back roughly 1% of total turnover whichever risk you pick. A strategy can decide whether that 1% leaks out in a smooth line or in violent swings, but it cannot turn the sign positive.
So the honest answer to “how to win Plinko every time” is: you cannot, and anyone claiming otherwise is selling a forecast the game does not support. Drops are modelled as independent events; past outcomes do not establish next-pocket predictability, and a seed hash shown after a round is not the unrevealed seed or a forward prediction. What you can do is pick a staking rule whose swings suit your bankroll and your patience, then test it on our Plinko simulator or against the logged runs on the results page before trusting it with a long auto session.
The rest of this page treats each strategy as a bankroll-shaping tool. For every rule we give the exact mechanics, a worked example in FUN credits, and the failure mode to watch for on a bankroll graph.
Fixed and percentage stakes
The two simplest strategies are also the two everything else is measured against. Fixed staking bets the same amount every drop, regardless of what just happened. Percentage staking bets a set fraction of your current bankroll, so stakes shrink after losses and grow after wins automatically.
In our replay rules, the fixed strategy bets 1 FUN every drop from a 1000 FUN starting bank. The percentage strategy bets 0.5% of the current bank, rounded down to a whole 0.01 FUN. At the start that is 5.00 FUN; if the bank slides to 800 FUN the stake becomes 4.00 FUN; if a lucky run lifts the bank to 1400 FUN the stake rises to 7.00 FUN. Both rules check before every bet that the stake is within the 100 FUN cap and that the remaining bank can cover it, and the run stops rather than silently clipping a stake the strategy asked for but cannot afford.
A worked example shows why settlement maths matters here. On Low risk, a 2 FUN stake landing on the 0.5 pocket returns 2 × 0.5 = 1 FUN, a net of −1 FUN. Landing on the 9 pocket returns 2 × 9 = 18 FUN, a net of +16 FUN. Because Low’s centre pockets pay 1 or close to it, 34.912109375% of drops break exactly even and only 19.638% are outright losses, which is why Low-risk bankroll graphs look flat compared with High, where 78.989% of drops lose.
Fixed staking keeps exposure at 1 FUN per drop. The expected loss accumulates with turnover, but an individual recorded line can rise, fall or jump; it does not have to follow a straight downward slope. The per-drop payout standard deviation is approximately 0.332 times stake on Low, 1.467 on Normal and 6.565 on High. Percentage staking changes exposure as the bank changes. Our 0.5% default starts at 5 FUN, five times the fixed rule’s stake, so compare turnover and drawdown as well as ending profit. A larger stake can create a larger profit or loss on the same pocket without improving its probability.

Can you choose that stake in the game?
The amount buttons matter when you take a rule out of a spreadsheet. In our FUN interface, successive plus presses select 1, 2, 3, 5, 10, 15, 20, 30, 50, 75 and 100. A request for 4 FUN therefore cannot be followed literally with these buttons. The collected study used 1 FUN throughout, so its observed returns are unaffected.
Our original charts calculate ideal stake amounts to cents. The simulator now also has a demo-button option: it checks the minimum and cap first, then lowers an allowed request to the nearest available amount. For instance, a request for 8 becomes 5 FUN. That is a changed progression, so compare its new curve rather than treating it as an exact Martingale. Percentage stakes stop below the 1 FUN minimum. The selected full-history centre rules use 1 and 50 FUN, both available amounts.
- Open the demo and set Lines to 16 so your session matches the probabilities quoted on this page.
- Choose a Risk Level. Low for the flattest graph, High only if you accept that most drops lose.
- For fixed staking, set the Bet to 1 FUN and leave it untouched for the whole session.
- For percentage staking, calculate 0.5% of your current bank, round down to 0.01 FUN, and re-enter the stake whenever the bank moves enough to change it.
- Record your balance every 50 drops so you can compare your own graph with the replay charts.
Fixed stake
Keep the same stake for every drop.
The graph uses mathematical stake amounts. Exact doubles and percentage stakes may be absent from the game’s buttons; choose demo amounts in the simulator to compare the adjusted version.
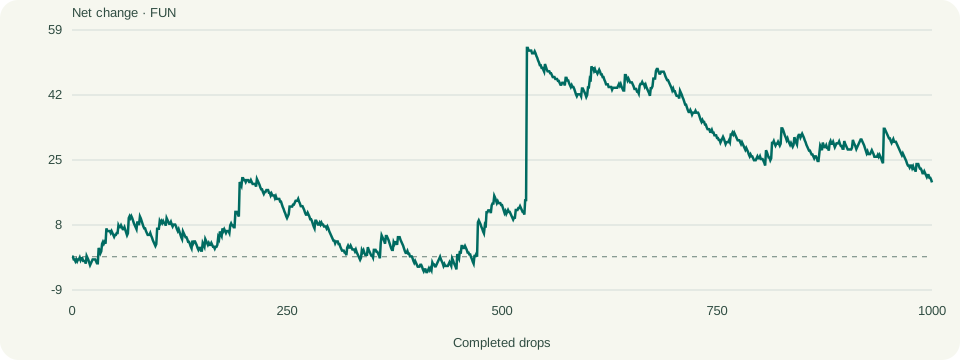
Exactly what to do on each drop
- Keep the same stake for every drop.
- Start this comparison with 1,000 FUN and a 1 FUN base stake. The percentage rule instead calculates 0.5% of the current bank.
- A return below the stake counts as a net loss; an exact return holds the step. Check the required next stake before clicking.
- Stop before exceeding the 100 FUN cap or remaining balance. Stop limits use −20/+20 FUN per cycle; restarting keeps the remaining bank.
Percentage of balance
Recalculate 0.5% of the remaining balance before each drop.
The graph uses mathematical stake amounts. Exact doubles and percentage stakes may be absent from the game’s buttons; choose demo amounts in the simulator to compare the adjusted version.
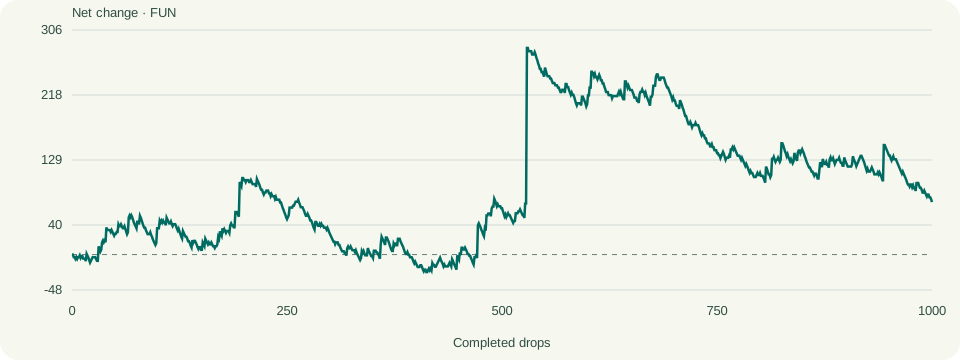
Exactly what to do on each drop
- Recalculate 0.5% of the remaining balance before each drop.
- Start this comparison with 1,000 FUN and a 1 FUN base stake. The percentage rule instead calculates 0.5% of the current bank.
- A return below the stake counts as a net loss; an exact return holds the step. Check the required next stake before clicking.
- Stop before exceeding the 100 FUN cap or remaining balance. Stop limits use −20/+20 FUN per cycle; restarting keeps the remaining bank.
Martingale, capped Martingale and Fibonacci
Martingale, capped Martingale and Fibonacci raise stakes after net losses. The idea is to recover earlier losses with a later payout, but a net win in Plinko can be too small to do that. A 1.1× return adds just 10% of that stake. Calling every positive return a win does not turn this into an even-money game. The rule still resets or moves back after that small net win, because those are the rules we chose before replaying it. This distinction matters when translating a familiar betting system into a variable-multiplier game.
Plain Martingale in our replay rules doubles the stake on a net loss, resets to the 1 FUN base on a net win, and leaves the stake unchanged on a break-even drop. That break-even clause matters on Low risk, where over a third of drops return exactly the stake. A losing sequence on Normal risk from a 1 FUN base runs 1, 2, 4, 8, 16, 32, 64 — and the next bet would be 128, which breaches the 100 FUN cap. Under our rules the run stops there rather than clipping to 100, because silently changing the stake would corrupt the test. Seven consecutive net losses is not exotic: on High risk, where 78.989% of drops lose, strings of that length are routine.
Capped Martingale uses stakes of 1, 2, 4, 8 and 16 FUN after successive net losses, then resets after a loss on 16. Those five stakes total 31 FUN of turnover, not necessarily 31 FUN lost. On High, five 0.2× returns pay back 6.2 FUN, leaving a net loss of 24.8. The next stake returns to 1 FUN; a 2× payout on that bet adds only 1 FUN and does not erase the previous loss. This reset limits the ladder’s size. It does not restore the bank or guarantee completion of a longer session.
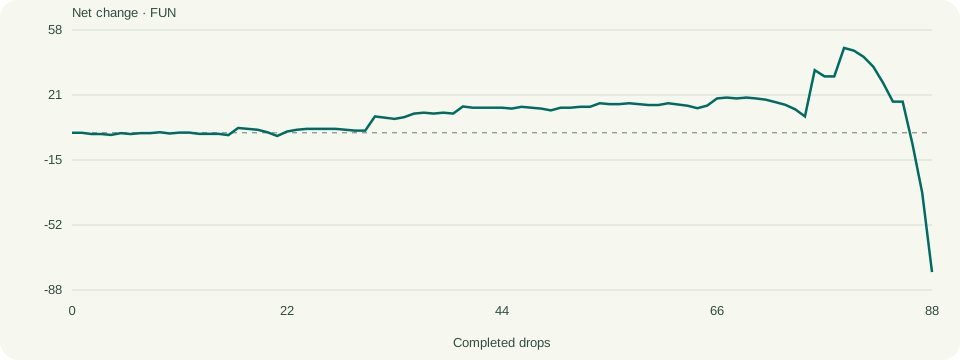
Fibonacci starts 1, 1, 2, 3, 5 and 8 units, moving forward after a net loss and back two positions after a net win. The first six stakes total 20 FUN, compared with 63 FUN for Martingale’s first six. On High, six 0.2× returns would therefore lose 16 FUN with Fibonacci and 50.4 FUN with Martingale. These are illustrative sequences, not a forecast. A smaller early ladder delays large stakes, but the sequence can still exceed the 100 FUN cap or the available bank. Our recorded High replay stopped Fibonacci after 30 bets; the rule was asking for more than the cap allowed.
Why these fail quietly on High risk
High risk pays 0.2 on the five pockets nearest the centre, and those pockets hold the bulk of the probability mass. A loss-chasing system on High therefore doubles into a headwind: most drops lose 80% of an ever-growing stake. The theoretical RTP barely moves between risk levels, but the path to realising it is brutal. If you want to test a chaser, do it on Low or Normal first, where break-even and small-profit pockets interrupt losing strings far more often.
| Rule | After net loss | After net win | First six stakes total | Net if all six return 0.2× |
|---|---|---|---|---|
| Martingale | Double | Reset | 63 FUN | −50.4 FUN |
| Capped Martingale | 1–2–4–8–16, then reset | Reset | 32 FUN | −25.6 FUN |
| Fibonacci | Forward one position | Back two positions | 20 FUN | −16 FUN |
Martingale
Double after a net loss; return to the base stake after a net win.
The graph uses mathematical stake amounts. Exact doubles and percentage stakes may be absent from the game’s buttons; choose demo amounts in the simulator to compare the adjusted version.
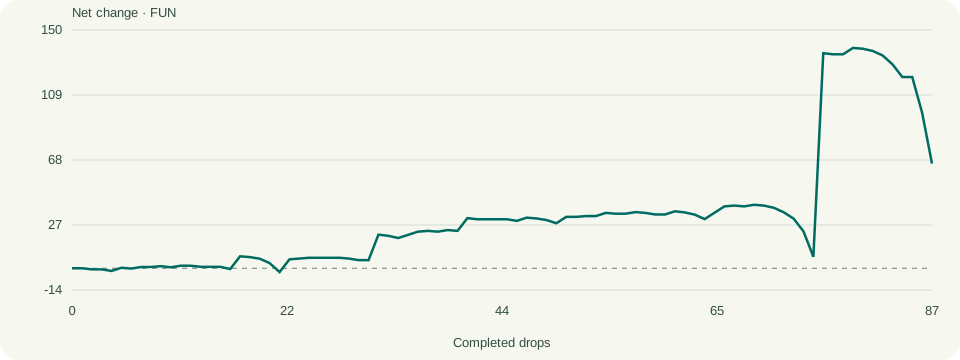
Exactly what to do on each drop
- Double after a net loss; return to the base stake after a net win.
- Start this comparison with 1,000 FUN and a 1 FUN base stake. The percentage rule instead calculates 0.5% of the current bank.
- A return below the stake counts as a net loss; an exact return holds the step. Check the required next stake before clicking.
- Stop before exceeding the 100 FUN cap or remaining balance. Stop limits use −20/+20 FUN per cycle; restarting keeps the remaining bank.
Capped Martingale
Use 1, 2, 4, 8 and 16 units, then reset after the fifth loss.
The graph uses mathematical stake amounts. Exact doubles and percentage stakes may be absent from the game’s buttons; choose demo amounts in the simulator to compare the adjusted version.
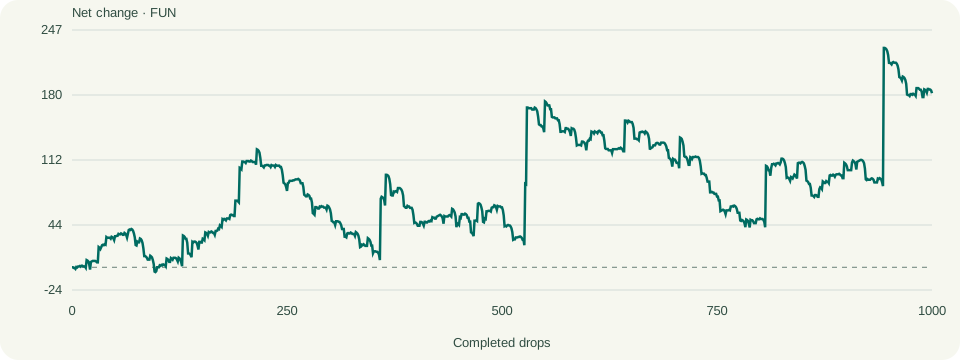
Exactly what to do on each drop
- Use 1, 2, 4, 8 and 16 units, then reset after the fifth loss.
- Start this comparison with 1,000 FUN and a 1 FUN base stake. The percentage rule instead calculates 0.5% of the current bank.
- A return below the stake counts as a net loss; an exact return holds the step. Check the required next stake before clicking.
- Stop before exceeding the 100 FUN cap or remaining balance. Stop limits use −20/+20 FUN per cycle; restarting keeps the remaining bank.
Fibonacci
Move one place forward after a loss and two back after a win.
The graph uses mathematical stake amounts. Exact doubles and percentage stakes may be absent from the game’s buttons; choose demo amounts in the simulator to compare the adjusted version.
Exactly what to do on each drop
- Move one place forward after a loss and two back after a win.
- Start this comparison with 1,000 FUN and a 1 FUN base stake. The percentage rule instead calculates 0.5% of the current bank.
- A return below the stake counts as a net loss; an exact return holds the step. Check the required next stake before clicking.
- Stop before exceeding the 100 FUN cap or remaining balance. Stop limits use −20/+20 FUN per cycle; restarting keeps the remaining bank.
D’Alembert, Paroli and 1–3–2–6
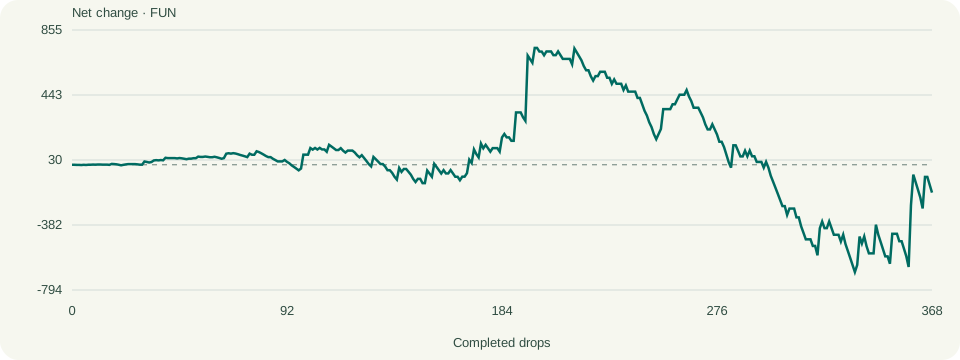
D’Alembert adds one base unit after a net loss and subtracts one after a net win, down to a minimum of one. Three losses followed by two wins produce stakes of 1, 2, 3, 4 and 3 FUN; the next required stake is 2. The increments are linear, but that does not remove cap or balance risk. Our Normal replay stopped at the 100 FUN stake cap after 368 bets, and its largest fall from a previous bank peak was 1,421.8 FUN. A progression can have a large drawdown even when it ends with money still in the bank. Read the graph and the stopping reason together.
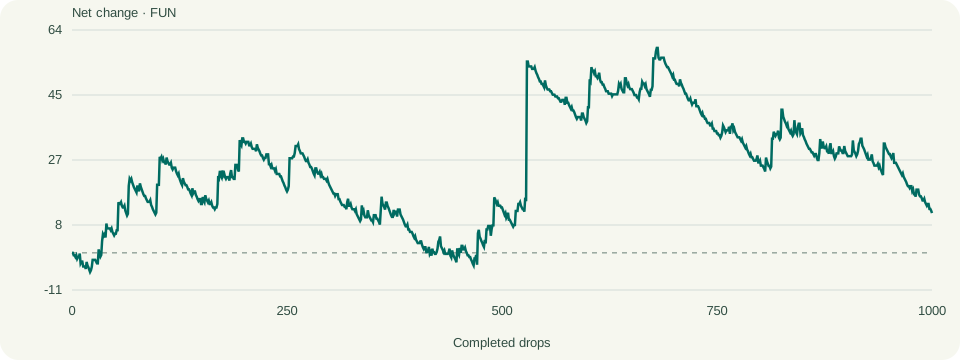
Paroli increases stakes after wins. Starting from 1 FUN, the stakes after successive net wins are 1, 2 and 4, then the rule resets. A net loss also resets; an exact return holds the current step. The amount actually lost depends on the multiplier. A 4 FUN bet returning 0.2× pays back 0.8 FUN and loses 3.2. Returning 0.5× would lose 2. The next bet is still 1 FUN in either case. This system limits the win ladder to three steps, but a series of unsuccessful cycles can keep reducing the bank.
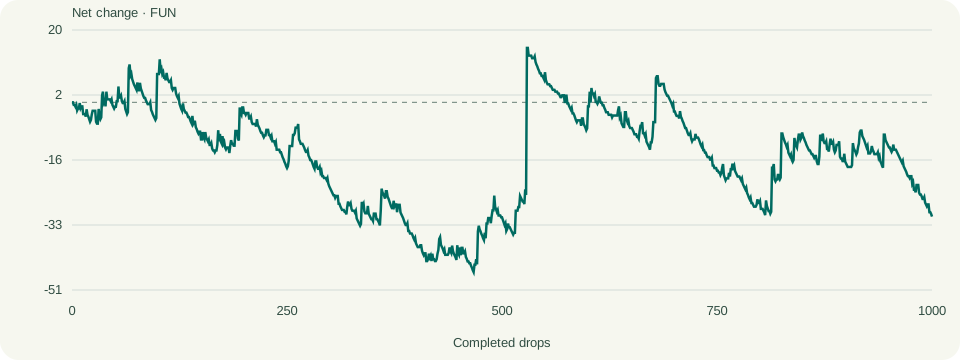
The 1–3–2–6 rule moves through those four stakes after successive net wins and resets after a net loss. If every winning return were exactly 2×, four wins would add 1+3+2+6 = 12 units. That is a worked arithmetic case, not the definition of a Plinko win. On the Low table, two 1.1× wins at stakes 1 and 3 add only 0.4 FUN altogether. If the next 2 FUN stake returns 0.5×, it loses 1 FUN and the three-drop cycle ends −0.6. Prior winning drops therefore do not guarantee that the remaining steps are playing with profit.
These systems answer different questions about changing stakes. D’Alembert responds to losses by adding one unit; Paroli and 1–3–2–6 respond to wins with a bounded sequence. None requires the next drop to remember the last. Compare them on the same recorded pockets in the strategy simulator, using the same starting bank and cap. Inspect the stakes and returned amounts in the log when a graph looks surprising. The settings guide explains why a small winning multiplier can reset a system while recovering very little money.
| Strategy | Type | Stakes on L, L, W, W (base 1) | Worst single-drop loss |
|---|---|---|---|
| D’Alembert | Loss-chaser, linear | 1, 2, 3, 2 | Current rung, grows slowly |
| Paroli | Win-press, max 3 steps | 1, 1, 1, 2 | 4 FUN (third rung) |
| 1–3–2–6 | Win-press, fixed cycle | 1, 1, 1, 1 | 6 FUN (fourth step) |
D’Alembert
Add one unit after a net loss; subtract one after a net win, down to one.
The graph uses mathematical stake amounts. Exact doubles and percentage stakes may be absent from the game’s buttons; choose demo amounts in the simulator to compare the adjusted version.
Exactly what to do on each drop
- Add one unit after a net loss; subtract one after a net win, down to one.
- Start this comparison with 1,000 FUN and a 1 FUN base stake. The percentage rule instead calculates 0.5% of the current bank.
- A return below the stake counts as a net loss; an exact return holds the step. Check the required next stake before clicking.
- Stop before exceeding the 100 FUN cap or remaining balance. Stop limits use −20/+20 FUN per cycle; restarting keeps the remaining bank.
Paroli
Double after a net win, up to three successive wins; then reset.
The graph uses mathematical stake amounts. Exact doubles and percentage stakes may be absent from the game’s buttons; choose demo amounts in the simulator to compare the adjusted version.
Exactly what to do on each drop
- Double after a net win, up to three successive wins; then reset.
- Start this comparison with 1,000 FUN and a 1 FUN base stake. The percentage rule instead calculates 0.5% of the current bank.
- A return below the stake counts as a net loss; an exact return holds the step. Check the required next stake before clicking.
- Stop before exceeding the 100 FUN cap or remaining balance. Stop limits use −20/+20 FUN per cycle; restarting keeps the remaining bank.
1–3–2–6
Stake one, three, two and six units after successive net wins.
The graph uses mathematical stake amounts. Exact doubles and percentage stakes may be absent from the game’s buttons; choose demo amounts in the simulator to compare the adjusted version.
Exactly what to do on each drop
- Stake one, three, two and six units after successive net wins.
- Start this comparison with 1,000 FUN and a 1 FUN base stake. The percentage rule instead calculates 0.5% of the current bank.
- A return below the stake counts as a net loss; an exact return holds the step. Check the required next stake before clicking.
- Stop before exceeding the 100 FUN cap or remaining balance. Stop limits use −20/+20 FUN per cycle; restarting keeps the remaining bank.
Stop limits and restarting
The last two replay rules are not staking systems at all; they are session disciplines layered on a flat 1 FUN stake. The stop-limits rule pauses the session the moment the cycle net result reaches −20 FUN or +20 FUN. The restart rule uses the same thresholds but resumes immediately using whatever bank remains, and combined losses are never erased. If a cycle ends at −20 and the next cycle ends at −20, the running total is −40, not a fresh zero.
The game’s Auto mode exposes a number-of-bets count and a Stop button; we did not observe native stop-loss or take-profit controls in the interface. So if you want threshold discipline, you enforce it yourself: watch the balance, and when your chosen limit is hit, press Stop or close the session. In Manual mode this is trivial; in Auto, set the bet count low enough that you can intervene between batches.
A practical example: you start with 1000 FUN, flat 1 FUN stakes on Normal risk, with ±20 limits. Normal’s profit probability is only 21.0113525390625% per drop and its standard deviation is 1.4672407092599933, so a −20 swing can arrive within a few dozen drops. When it does, you stop, note the result, and either walk away (stop-limits) or start a new cycle from 980 FUN (restart). Over many cycles the restart rule produces a sawtooth graph: repeated small climbs and drops bounded at ±20, drifting down at the house margin overall.
When reading bankroll graphs against live play, note that multiple moving balls on screen can be separate already-settled drops, and the animation may lag the balance update. Trust the balance figure, not the balls still bouncing, when checking whether a limit has been reached. The how to play guide walks through every control if any of this is unfamiliar.
- Decide your thresholds before the first drop — our tests use −20 and +20 FUN per cycle.
- Choose stop-limits if you want hard session ends, restart if you want continuous play with logged cycles.
- In Auto mode, set a modest number of bets per batch so you can check the balance between batches.
- When a threshold is hit, record the cycle result and the remaining bank before doing anything else.
- Under restart rules, carry the running total forward; never treat a new cycle as a clean slate.
Stop limits
Keep a fixed stake and finish when the session net crosses either limit.
The graph uses mathematical stake amounts. Exact doubles and percentage stakes may be absent from the game’s buttons; choose demo amounts in the simulator to compare the adjusted version.
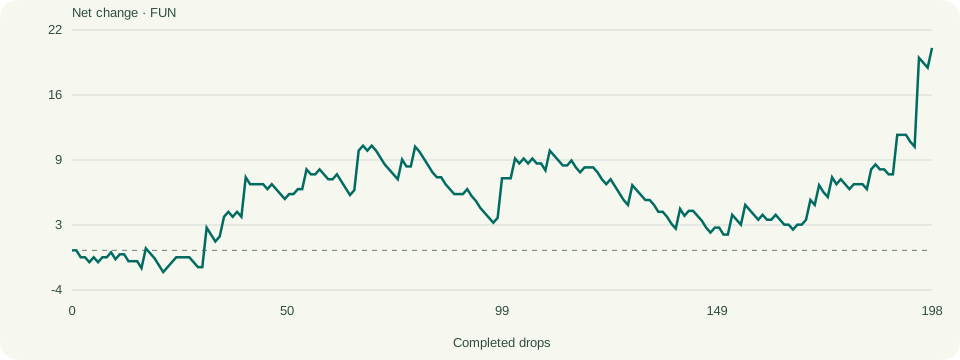
Exactly what to do on each drop
- Keep a fixed stake and finish when the session net crosses either limit.
- Start this comparison with 1,000 FUN and a 1 FUN base stake. The percentage rule instead calculates 0.5% of the current bank.
- A return below the stake counts as a net loss; an exact return holds the step. Check the required next stake before clicking.
- Stop before exceeding the 100 FUN cap or remaining balance. Stop limits use −20/+20 FUN per cycle; restarting keeps the remaining bank.
Restart after a limit
Keep the remaining balance and resume fixed stakes after each limit.
The graph uses mathematical stake amounts. Exact doubles and percentage stakes may be absent from the game’s buttons; choose demo amounts in the simulator to compare the adjusted version.
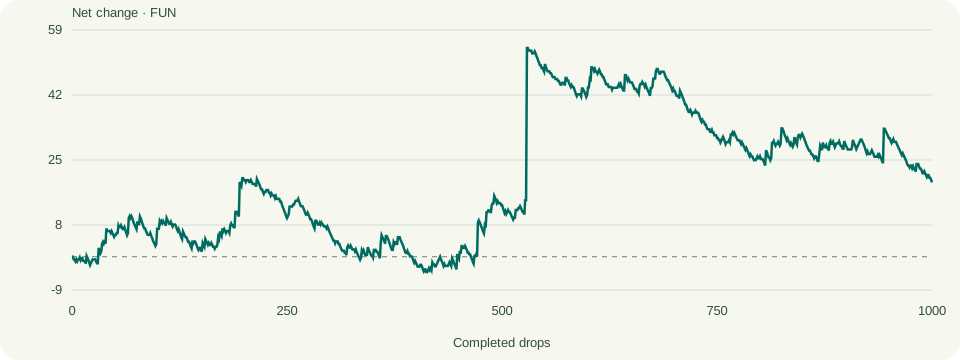
Exactly what to do on each drop
- Keep the remaining balance and resume fixed stakes after each limit.
- Start this comparison with 1,000 FUN and a 1 FUN base stake. The percentage rule instead calculates 0.5% of the current bank.
- A return below the stake counts as a net loss; an exact return holds the step. Check the required next stake before clicking.
- Stop before exceeding the 100 FUN cap or remaining balance. Stop limits use −20/+20 FUN per cycle; restarting keeps the remaining bank.
Forum patterns worth testing without treating them as forecasts
International forum threads about Plinko repeat a handful of patterns: increasing stakes after 25 low 0.2x returns in 30 drops, tapping the bet button 5–8 times in quick bursts, changing the seed after a cold run, and enduring long 1000x droughts on High risk. These are real questions players ask, but none of them is a proven winning method, and they are certainly not an Australian consensus. Each one is testable, and testing is the right response.
The stake-increase-after-low-returns idea is a centre-count signal, and it is the one pattern that can be formalised. Our fitting framework does exactly that: count paid drops landing in centre pockets over a rolling window, keep the base bet always on, and raise the next stake by an absolute boost when the previous window’s centre count meets a threshold. A cooldown after a boosted bet still spends base stakes and still updates the history, so the signal cannot be gamed by pausing. The trap to avoid is retrospective fitting: searching a full 1000-drop sample for the threshold that would have worked best is curve-fitting, not discovery. The honest version selects a rule using the first 600 drops, freezes it, then evaluates it on the last 400. A configuration that only wins on all 1000 rows it was tuned on is not held-out evidence.
Seed-changing and tap-rhythm patterns fail a more basic test. Drops are modelled as independent; a seed hash revealed after a round verifies that round but says nothing about the next pocket. Tapping 5–8 times just places 5–8 independent bets quickly. And 1000x droughts are not a pattern at all but a property of the table: either outermost pocket lands with a combined chance of 1 in 32,768 per drop, so even 3000 drops without a 1000× return is unremarkable on High at 16 rows — the normal approximation is poor in these rare tails, so intuition calibrated on the bell centre misleads at the edges.
If you want to evaluate any of these ideas yourself, run them in the free Plinko demo with fixed 16 rows and log every drop, or compare against the verified logged runs on the results page, where historical winning configurations are shown as things to inspect, not as future advantages. ACMA lists online casinos among services illegal for providers to offer to people in Australia, and prohibited services cannot be advertised here, so treat any Plinko product promising real-money play to Australians with caution and keep free virtual-only play separate from funded casino products. The apps page covers that landscape in more detail.
How to read the bankroll graphs on this page
Each strategy graph plots completed bets horizontally and net change in FUN vertically. The dashed zero line means the bank equals its starting value; +100 means a 1,000 FUN bank has become 1,100. The original recorded pockets determine each path. Look at the final net, the largest peak-to-trough fall and whether the line ends early because the next stake exceeded the cap or remaining bank. Drawdown measures a fall from an earlier peak; it is not automatically the starting bank needed to complete the rule. Individual recorded paths can rise or fall despite the game’s negative expected return.
Questions about Plinko
What is the best Plinko strategy?
No strategy changes the odds; every risk level returns about 98.99% on average. Fixed or 0.5% percentage staking gives the steadiest bankroll graph, while Martingale-style chasers risk hitting the 100 FUN cap during ordinary losing streaks.
Can you win Plinko every time with Martingale?
No. Martingale doubles after net losses, so seven consecutive losses from a 1 FUN base demands a 128 FUN bet that breaches the 100 FUN cap. On High risk, where 78.99% of drops lose, such streaks are routine, not rare.
Does changing the seed or tapping faster improve Plinko results?
No. Drops are modelled as independent events, and a seed hash shown after a round verifies that round only — it is not a forward prediction. Rapid taps simply place several independent bets quickly; neither habit moves the binomial landing probabilities.
Which risk level suits loss-chasing strategies?
Low or Normal. Low risk breaks even on 34.91% of drops, interrupting losing strings, while High pays 0.2 on the five centre pockets and loses on 78.99% of drops, so doubling stakes there compounds losses extremely fast.
Are the strategies on this page tested with real money?
No. All replay rules use FUN virtual credits with no cash value. Defaults are a 1,000 FUN starting bank, a 1 FUN base and a 100 FUN cap. Runs stop before any infeasible stake rather than silently reducing it. The graphs are replays of this project’s completed recorded sample; they are not real-money results.