
Find a pocket’s chance
These bars show the binomial model, not observed frequencies. Height is probability; left to right is pocket position. The tall centre is common, not more profitable. Payouts depend on the chosen game table.
Every Plinko ball looks chaotic, yet the maths underneath is one of the oldest distributions in statistics. On the 16-row board used throughout this guide, each drop is sixteen independent left-or-right bounces, which produces a predictable bell shape across the seventeen pockets. Once you can read that shape, you can calculate the exact chance of any pocket, the expected return of any risk level, and the realistic odds of ever seeing the 1000x edge. This page walks through the numbers step by step, using the official BGaming Original Plinko paytable, so you can use the odds calculator above with genuine understanding rather than guesswork.
Read the bell shape in one minute
Picture the 16-row board as sixteen coin flips stacked vertically. At each peg the ball goes left or right with equal probability, and after sixteen bounces it lands in one of seventeen pockets, indexed 0 to 16 from left to right. The pocket index simply counts how many times the ball went right. Eight rights out of sixteen puts the ball dead centre; sixteen rights sends it to the far edge. Because there are thousands of different bounce sequences that produce eight rights, but only one sequence that produces sixteen, the centre pockets swallow most of the probability while the edges are vanishingly rare.
The exact centre pocket, index 8, lands with probability C(16,8) divided by 65,536, which is 19.638%. The two pockets either side of centre each take 17.4560546875%, and the probabilities taper symmetrically towards the edges. One specific edge pocket, say index 16, lands only 1 time in 65,536 drops, while either edge combined lands 2 in 65,536, or 1 in 32,768. That symmetry matters: the board has no left or right bias in the model, so any pattern you think you see favouring one side is noise.
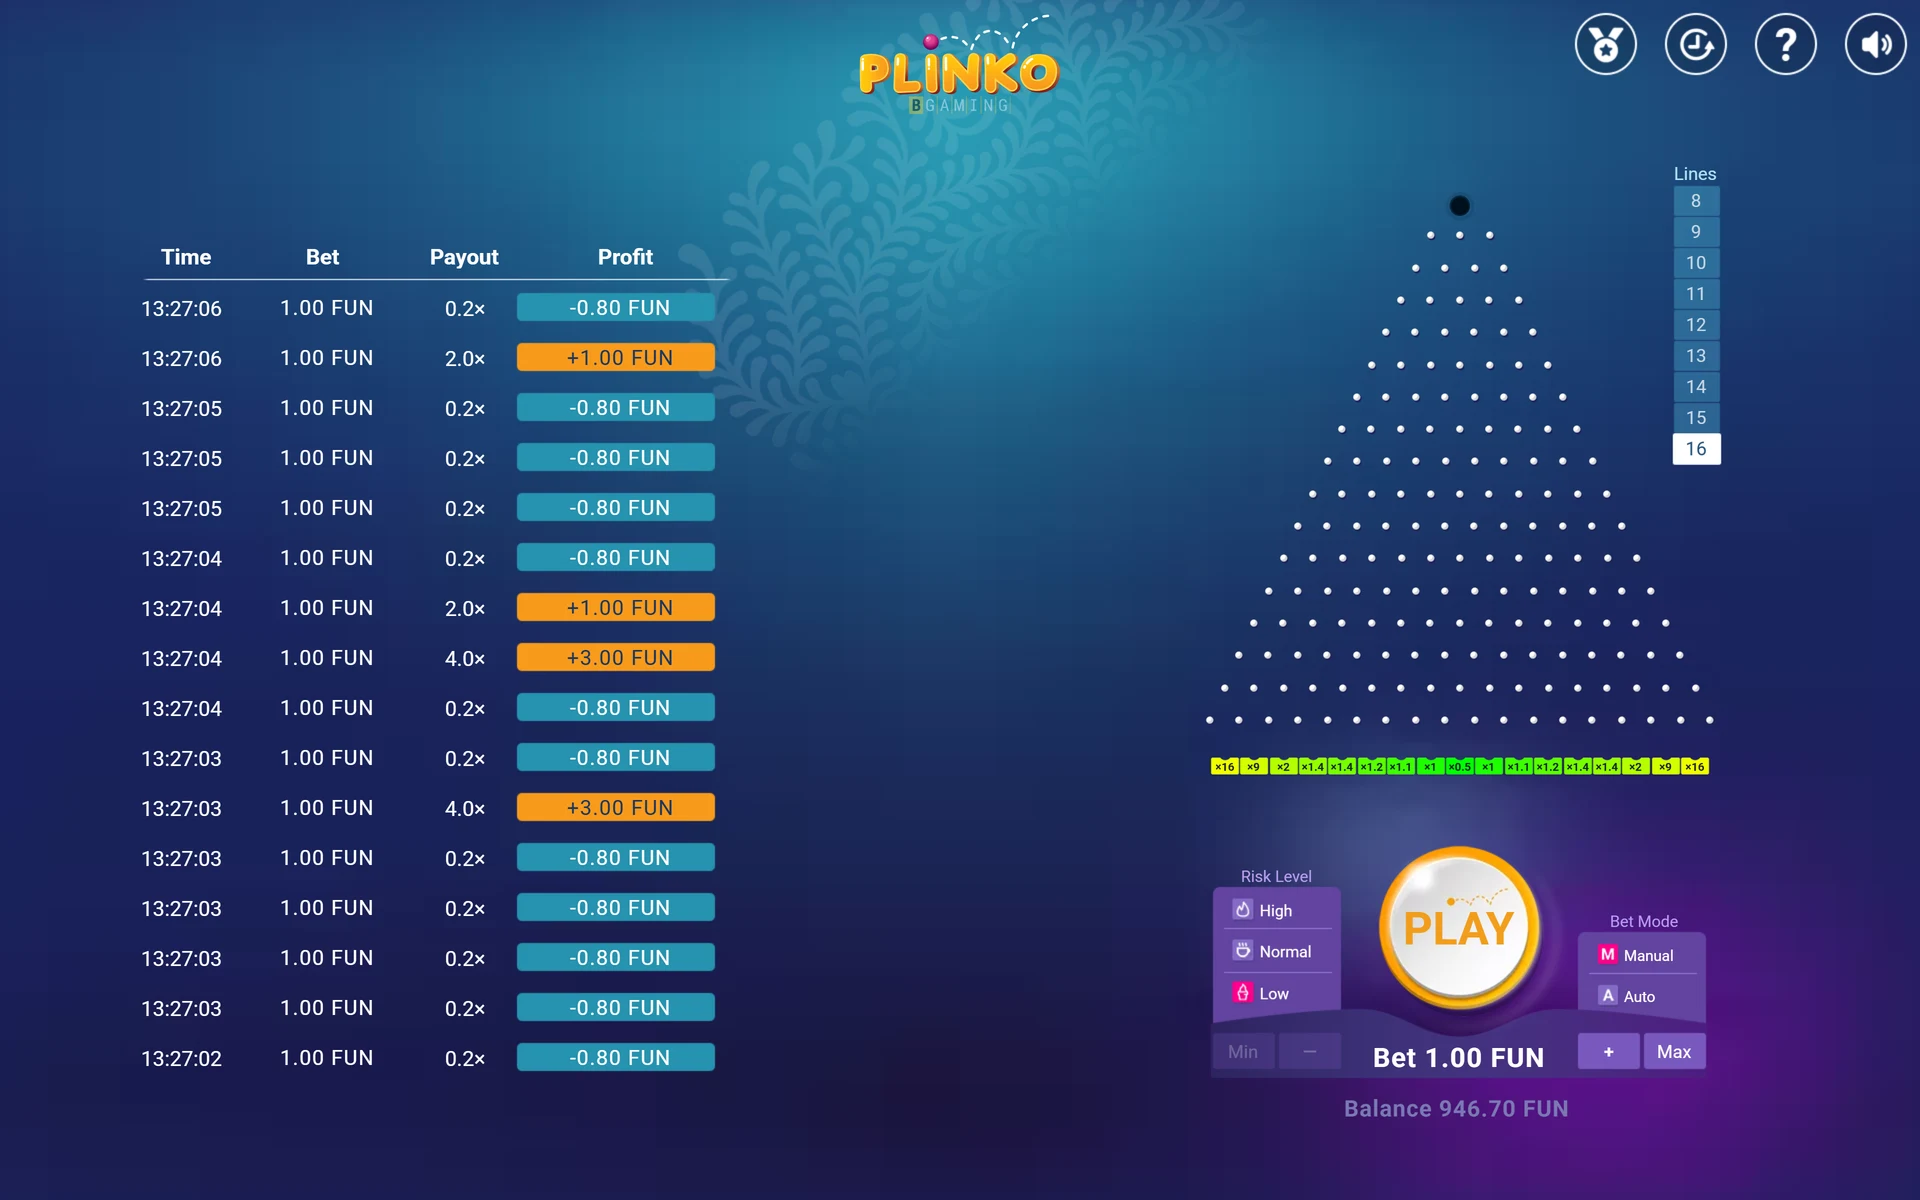
The on-page chart draws this as a bar for each pocket, with pocket index on the horizontal axis and landing probability on the vertical axis. The shape is bell-like, but it is a discrete binomial distribution, not a true continuous normal curve. That distinction becomes important in the tails, where the normal approximation badly misstates how rare the edge pockets really are. If you want a hands-on feel for the shape before reading further, the Plinko simulator lets you watch drops accumulate into the bell in real time.
One practical reading tip: add pockets in pairs from the centre outwards. The middle three pockets (indices 7, 8 and 9) together account for roughly 54.6% of all drops. The middle seven account for about 92.3%. Everything outside that central band — the big multipliers everyone screenshots — shares the remaining sliver. Frequent small results sit in the middle; rare dramatic results sit at the edges.
Count paths with the binomial distribution
The probability of any pocket comes from a simple counting argument. There are 2^16 = 65,536 equally likely bounce sequences on a 16-row board. The number of those sequences that end in pocket k is the binomial coefficient C(16,k), read as "16 choose k", which counts the ways to pick which k of the sixteen bounces went right. So pocket k's probability is C(16,k)/65,536. For the centre, C(16,8) = 12,870, giving 12,870/65,536 = 19.638%. For the edge, C(16,16) = 1, giving 1/65,536.
You can build the whole row of coefficients with Pascal's triangle: 1, 16, 120, 560, 1,820, 4,368, 8,008, 11,440, 12,870, then mirroring back down. Divide each by 65,536 and you have the exact landing vector used by every risk level. Notice that Low, Normal and High risk all share this identical vector — the Lines and Risk Level controls change what pockets pay, never where the ball lands. A 16-row High board and a 16-row Low board produce the same landing pattern; only the paytable differs.
Here is a worked example you can verify with any calculator. What is the chance of landing in pocket 2 (two from the left edge)? C(16,2) = 120, so the probability is 120/65,536 = 0.0018310546875, about 0.183%, or roughly 1 in 546 drops. On High risk that pocket pays 26x; on Low it pays 2x. Same ball behaviour, different consequence.
The binomial model also tells you what the game cannot do. Because drops are independent, the probability of pocket 16 on the next drop is 1/65,536 whether the last drop hit the edge, the centre, or anything else. Past outcomes do not establish next-pocket predictability. A seed hash shown after a round proves the result was committed in advance; it is not the unrevealed seed and not a forward prediction. Any tool or person claiming to read future pockets from past ones is contradicting the independence the model is built on. Our predictor page explains exactly why those claims fail.
| Pocket index | Paths C(16,k) | Probability | Approx. 1 in |
|---|---|---|---|
| 8 (centre) | 12,870 | 19.6381% | 5.1 |
| 6 or 10 | 8,008 | 12.2192% | 8.2 |
| 4 or 12 | 1,820 | 2.7771% | 36 |
| 2 or 14 | 120 | 0.1831% | 546 |
| 1 or 15 | 16 | 0.0244% | 4,096 |
| 0 or 16 (edge) | 1 | 0.001526% | 65,536 |
Turn a pocket chance into a payout expectation
Expected value is where probability meets the paytable. Settlement in BGaming Original Plinko is straightforward: stake multiplied by the pocket multiplier equals your payout, and payout minus stake equals your net result. A 2 FUN stake landing on 0.5x returns 1 FUN, a net of −1 FUN. The same 2 FUN on 9x returns 18 FUN, a net of +16 FUN. To get the expected return of a whole risk level, multiply each pocket's probability by its multiplier and add all seventeen products together.
Take Low risk as a worked example. The centre pocket (index 8, 0.5x) contributes 0.196381 × 0.5 = 0.0982 to the expected return. The two 1x pockets either side contribute their probability in full. The 16x edge pockets contribute 0.0000152587890625 × 16 each, about 0.000244 — real, but tiny. Summing all seventeen contributions gives a mean return multiplier of 0.9899871826171875, which is the theoretical RTP of 98.999%. In plain terms, for every 100 FUN staked on Low risk over the long run, the model returns about 99 FUN.
Repeat the exercise on High risk and the character changes completely. The five central pockets all pay 0.2x, so the most common results return only a fifth of the stake. The 1000x edges contribute 0.0000152587890625 × 1000 = 0.01526 each — together about 0.0305, or roughly 3% of the entire expected return, carried by pockets you will almost never see. The mean works out to 0.989764404296875, an RTP of 98.976%. Nearly identical long-run return to Low, delivered in a completely different rhythm.
The calculator above supplies pocket probabilities for the selected row count. To calculate a return yourself, choose the correct game paytable, multiply each pocket’s probability by its multiplier, and sum those products. Once you trust the method, you can interrogate any paytable claim yourself instead of taking screenshots at face value. The best settings guide applies this same arithmetic to choosing a risk level for a given session style, and the how to play walkthrough covers the controls — Lines, Risk Level, Bet stake and Bet Mode — that feed these numbers.
Why 1000 drops miss rare results
Here is the calculation that surprises most players. The chance of hitting at least one edge pocket in n drops is 1 minus the chance of missing every time: 1 − (65,535/65,536)^n for a specific edge, or 1 − (32,767/32,768)^n for either edge. After 1,000 drops, the probability of seeing at least one 1000x (either edge) is only about 3.0%. After 10,000 drops it is still just 26.3%. You need roughly 22,700 drops for a coin-flip chance of seeing one. Long 1000x droughts are not bad luck or a cold board; they are the base rate.
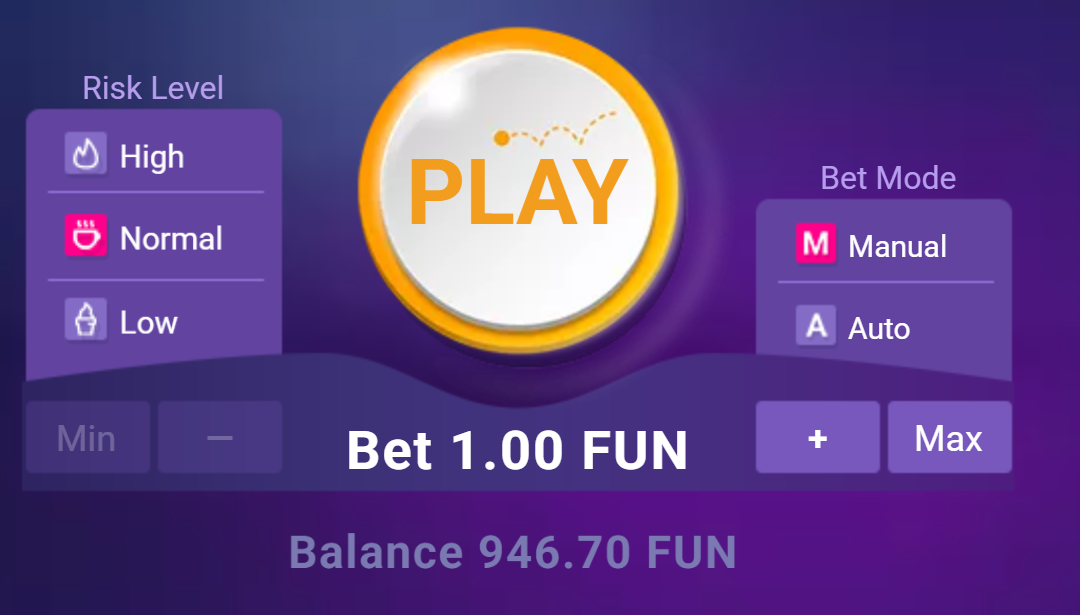
The same maths explains forum stories about stretches of 0.2x returns on High risk. The five central 0.2x pockets hold 0.196381 + 2 × 0.174560546875 + 2 × 0.1221923828125 = 0.789886 of the probability. A run of ten consecutive 0.2x landings has probability 0.7899^10, about 9.4% — unremarkable over a long session. Even twenty-five low returns in thirty drops is well inside normal variation for a board where four drops in five land in the centre five pockets.
Sample size also governs how much you can trust observed results. With a standard deviation of 6.565 multipliers per drop on High risk, the standard error of your mean return after 1,000 drops is about 6.5653/√1000 ≈ 0.2076. That means a 1,000-drop High-risk sample can easily show a return anywhere from roughly 0.57 to 1.41 around the true 0.9898 mean — a swing so wide it can look like winning or losing systems when neither exists. Low risk, with a standard deviation of 0.3319193191214202, converges far faster, which is why short Low-risk sessions feel "accurate" and short High-risk sessions feel random.
Our own results collection is built around this reality. The completed study contains 3,000 drops — 1,000 per risk level — with a separate 10-drop baseline excluded, and even that is a modest sample against the tail probabilities involved. You can browse the verified completed outcomes on the results page, but treat any short-run configuration that looks hot as something to evaluate, not a forward advantage.
RTP, win frequency and profit are different
Three numbers players constantly conflate: RTP, profit probability and break-even probability. RTP is the long-run average return per unit staked — 98.999% on Low, 98.988% on Normal, 98.976% on High. Profit probability is the chance a single drop returns more than your stake. Break-even probability is the chance it returns exactly your stake. These move in opposite directions across risk levels, which is the real trade-off the Risk Level control offers.
On Low risk, profit probability is 0.454498 — you come out ahead on about 45% of drops — with a further 0.349121 breaking even at 1x and only 0.196381 losing. On High risk, profit probability falls to 0.210114, break-even is exactly 0 (no pocket pays precisely 1x), and loss probability is 0.789886. Nearly four drops in five lose something on High, yet the RTP is barely lower than Low. The difference is that High's rare 130x and 1000x hits repay all those small losses in the model's long run.
Normal risk sits between the two: the same 0.210114 profit probability as High, but with 0.244385 break-even from the 1x pockets and a standard deviation of 1.4672407092599933, versus 6.565 on High and 0.3319193191214202 on Low. If you think of volatility as the price you pay in losing streaks for access to big multipliers, the three rows of the table below are the full menu.
None of this makes any risk level "best". A 100 FUN session on Low will typically end somewhere near 99 FUN with gentle swings; the same session on High could plausibly end at 40 FUN or 400 FUN. Choose based on which experience you actually want and what your virtual bankroll can absorb, and remember the currency here is FUN virtual credits with no cash value — the maths describes entertainment, not income. For structured staking approaches built on these numbers, the strategies page walks through flat betting, percentage staking and progression systems mechanically, including exactly when each one forces a stop.
| Measure | Low | Normal | High |
|---|---|---|---|
| Theoretical RTP | 98.9987% | 98.9883% | 98.9764% |
| Profit probability (per drop) | 45.45% | 21.01% | 21.01% |
| Break-even probability | 34.91% | 24.44% | 0% |
| Loss probability | 19.64% | 54.55% | 78.99% |
| Std deviation (multiplier) | 0.3319 | 1.4672 | 6.5653 |
| Max multiplier | 16x | 110x | 1000x |
| Chance of max (either edge) | 1 in 32,768 | 1 in 32,768 | 1 in 32,768 |
Use the calculator without assuming a result is due
The calculator on this page is designed to answer forward-looking questions honestly: given the binomial vector and a paytable, what is the chance of this pocket, this profit, this streak? What it will never tell you is that a result is "due". Independence means the board has no memory. After 5,000 drops without a 1000x, the chance on the next drop remains exactly 1/32,768 for either edge. The drought changes nothing, because the probabilities were never a schedule.
The gambler's fallacy shows up in Plinko in specific costumes. One is raising stakes after a run of 0.2x returns because a big pocket "must be close". The maths above shows such runs are ordinary, and the next drop's distribution is unchanged. Another is changing seeds or tapping a set number of times to "reset luck"; a seed hash verifies past commitment, it does not alter future probabilities. A third is switching risk levels mid-session as if the board were alternating between hot and cold modes, when Low and High share the identical landing vector.
Used properly, the calculator is a budgeting and expectation tool. Practical questions it answers well: how many drops can my bankroll survive at this stake given the loss probability? What fraction of drops will return nothing-like on High (78.99%)? What is the realistic chance I see a 110x or 1000x in a 200-drop session (about 0.61% for either edge)? Those answers shape sensible session plans — stake size, drop count, when to stop — without pretending to predict anything.
A note on automation: Auto bet mode exposes a number-of-bets count and a Stop button, and multiple moving balls on screen can be separate already-settled drops whose animation lags the balance. No native stop-loss or take-profit controls were observed in the current interface, so if you want loss or win limits you must enforce them yourself by watching the balance. Finally, a brief local note: in Australia, the ACMA lists online casinos among services that are illegal for providers to offer to people in Australia, and such services cannot be advertised here. This guide concerns free virtual-credit play and its mathematics; the apps page explains the differences between virtual-only play, ad-reward apps and funded casino products in more detail. Keep the calculator for what it is good at — turning the bell curve into clear expectations — and let the free demo supply the experimentation.
- Set Lines to 16 and pick a Risk Level; note that this changes the paytable, not the landing odds.
- Read the probability of your target pocket from the binomial vector: C(16,k)/65,536.
- Multiply that probability by the pocket multiplier to see its contribution to expected return.
- Use 1 − (1 − p)^n to find the chance of seeing a rare pocket at least once in n drops.
- Check profit and loss probabilities for your risk level before deciding stake and drop count.
- Set your own stop points, since Auto mode offers a bet count and Stop but no observed native stop-loss or take-profit.
Questions about Plinko
What is the probability of hitting 1000x in Plinko?
On the 16-row High-risk board, each 1000x edge pocket lands with probability 1/65,536, so either edge is 1 in 32,768 drops. Over 1,000 drops your chance of seeing one is only about 3%, no matter what happened previously.
Does risk level change where the ball lands?
No. Low, Normal and High at 16 rows share the identical Binomial(16, 0.5) landing vector. Risk Level only changes the multipliers attached to the seventeen pockets, which alters RTP distribution, profit probability and volatility, not landing odds.
What is the RTP of BGaming Original Plinko?
On 16 rows the theoretical RTP is 98.999% on Low, 98.988% on Normal and 98.976% on High. The figures are nearly identical; what changes dramatically is volatility, from a 0.3319 standard deviation on Low to 6.5653 on High.
Is a long losing streak a sign a big win is due?
No. Drops are independent, so past outcomes do not change the next drop's probabilities. On High risk, 78.99% of drops lose something by design, making long losing stretches ordinary. After any drought, the 1000x chance remains exactly 1 in 32,768.
Why is the centre pocket so common?
The centre requires eight right bounces in sixteen, and there are C(16,8) = 12,870 different bounce sequences that achieve this out of 65,536 total. That gives 19.64%. Edge pockets have only one possible sequence each, which is why they are so rare.
Can I predict Plinko results from the seed hash?
No. A seed hash shown before or after a round verifies the outcome was committed in advance; it is not the unrevealed seed and cannot be converted into a forward prediction. The model treats every drop as independent with fixed binomial probabilities.